How to Use WasteWise

Your comprehensive guide to mastering IWMI’s decision support platform. Learn how to transform waste burdens into circular economy opportunities.

Two Tools in One

1

Home Screen

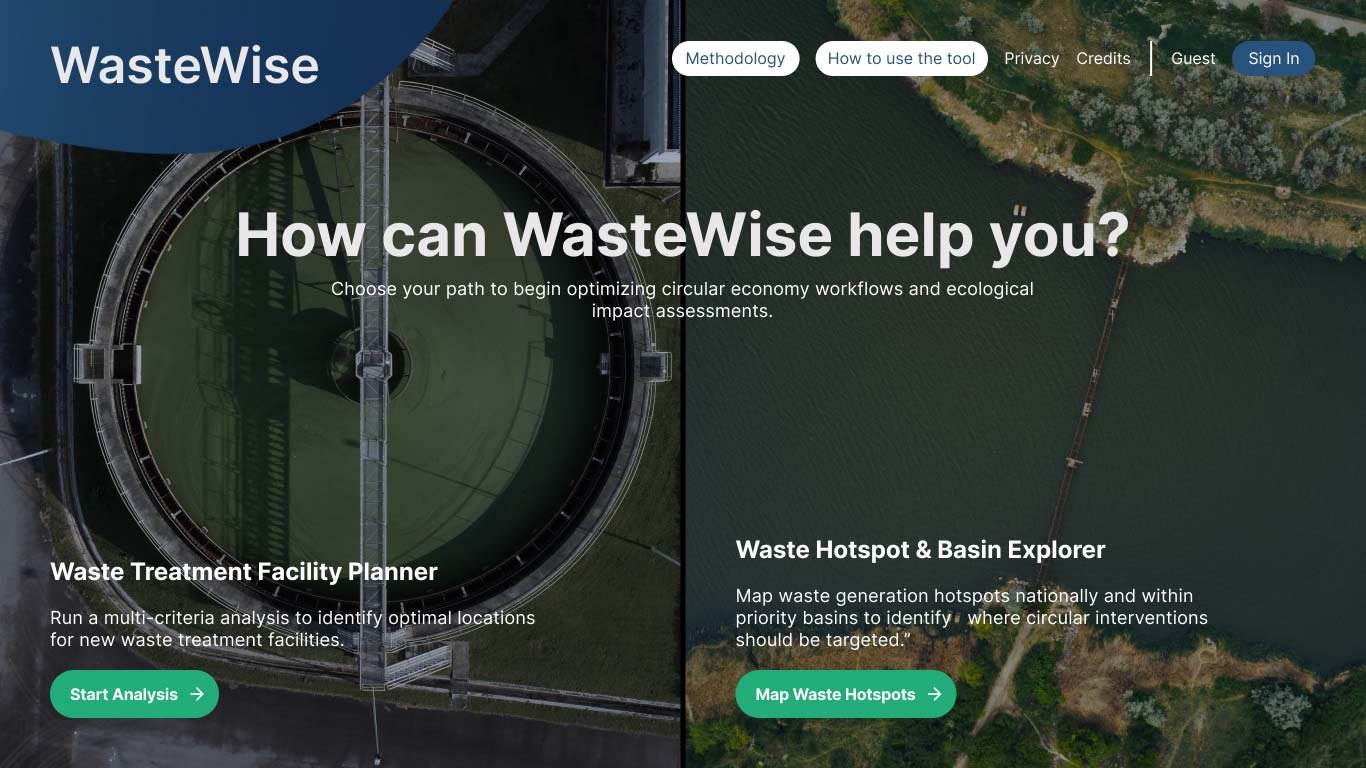
Welcome to WasteWise. The top navigation bar gives you immediate access to our scientific methodology, this user guide, and our privacy policy. You can also view your current account status here.

Tip


2

Choose Your Path

This screen serves as your main dashboard, presenting two analytical tracks:

1- Waste Treatment Facility Planner: Run multi-criteria evaluations to identify optimal geographic locations for setting up new waste treatment facilities.

2- Waste Hotspots & Basin Explorer: Map waste generation hotspots nationally or within specific priority basins to understand how waste loads affect waterways, ecosystems, and downstream communities.

Here below the step-by-step guides for both tools. You can click on any screenshot to view it full-size.

Waste Treatment Facility Planner

Step-by-step guide

1

Country, Region, and Goal Settings

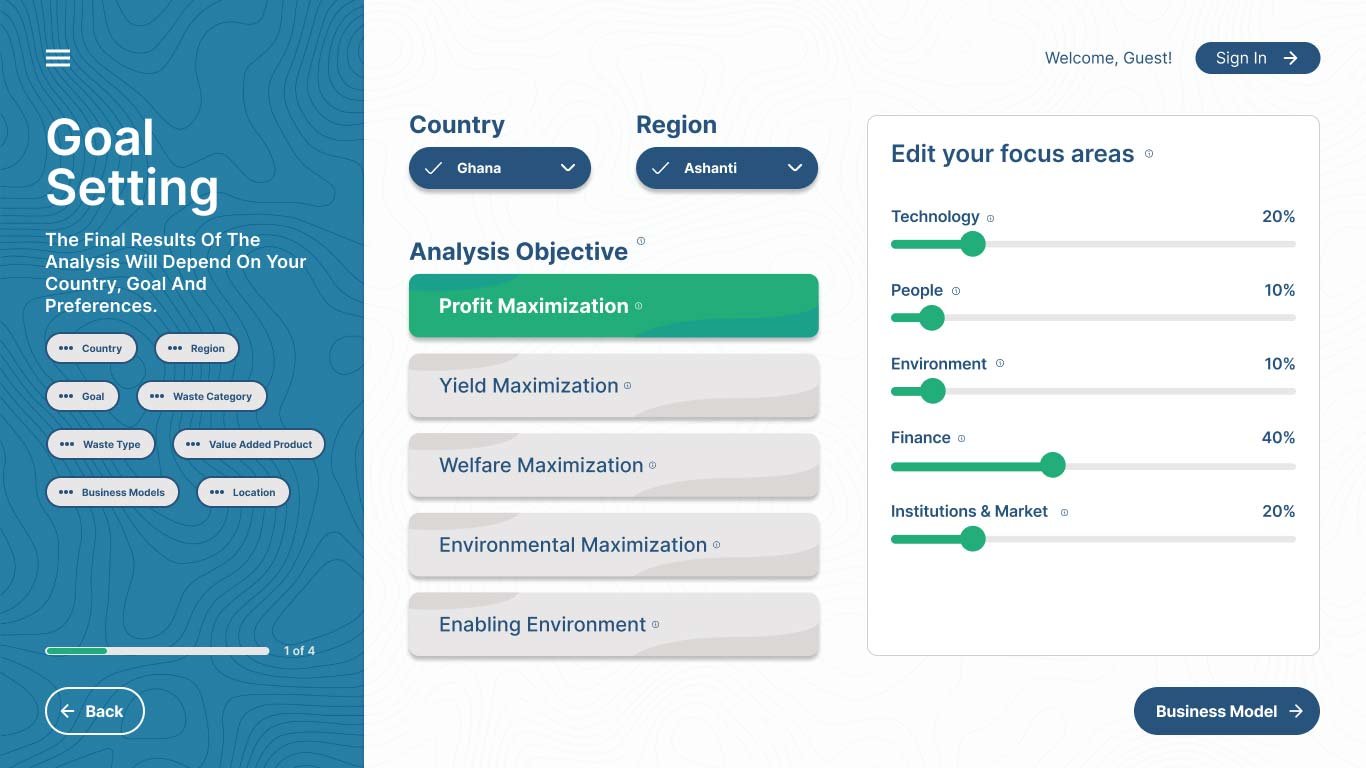
Begin setting up your scenario by selecting your target country and primary region. Don’t worry, you will be able to narrow your selection down to the district level in a later step.

Next, choose your primary Analysis Objective. What do you want to prioritize? Each objective automatically balances focus areas like technology, socio-economic factors, environmental impact, finance, and institutional market strength.

Tip


2

Waste Stream & Business Model Selection

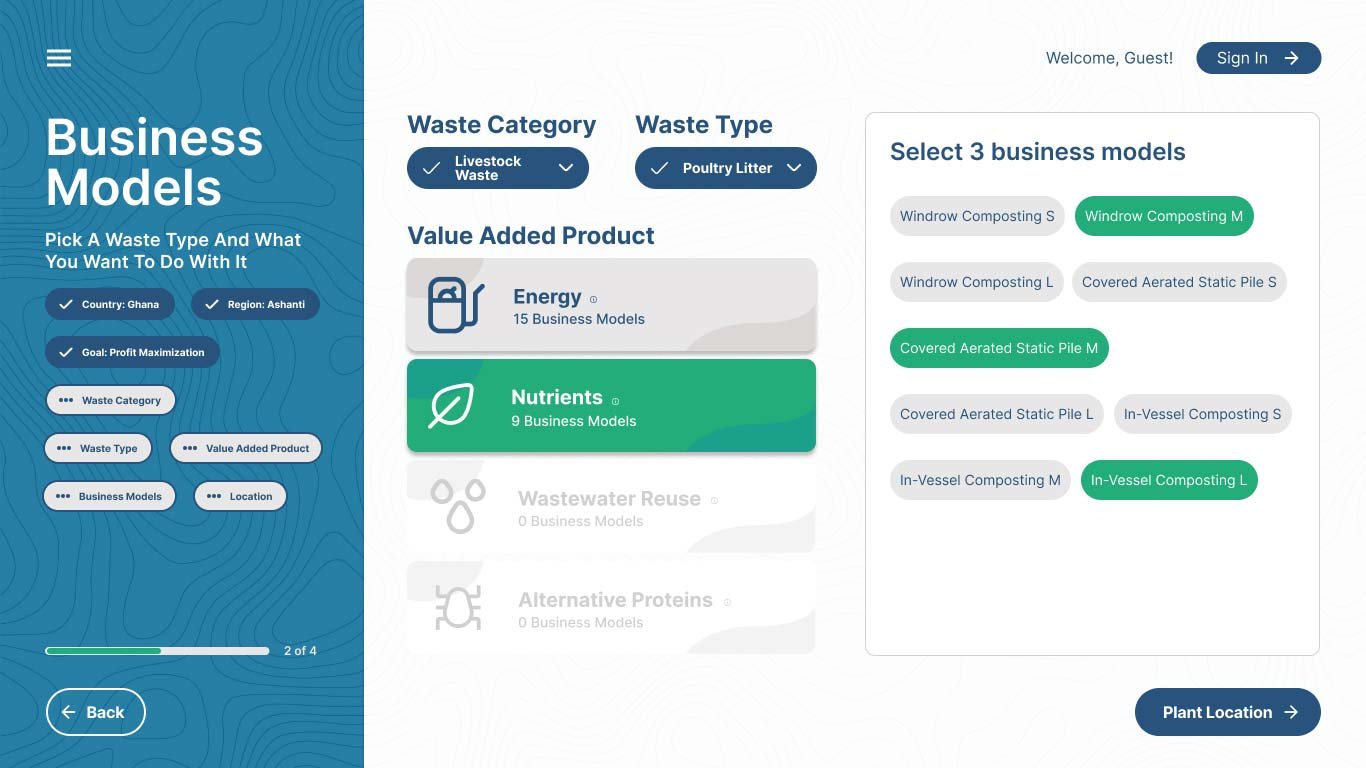
Refine your parameters by selecting a Waste Category, a specific Waste Type, and your desired Value-Added Product (such as Energy or Nutrients).

Based on your choices, the platform will generate a list of viable business models on the right side of the screen. Select exactly three models to enable a comparative analysis. Click Plant Location to proceed.


3

District Selection

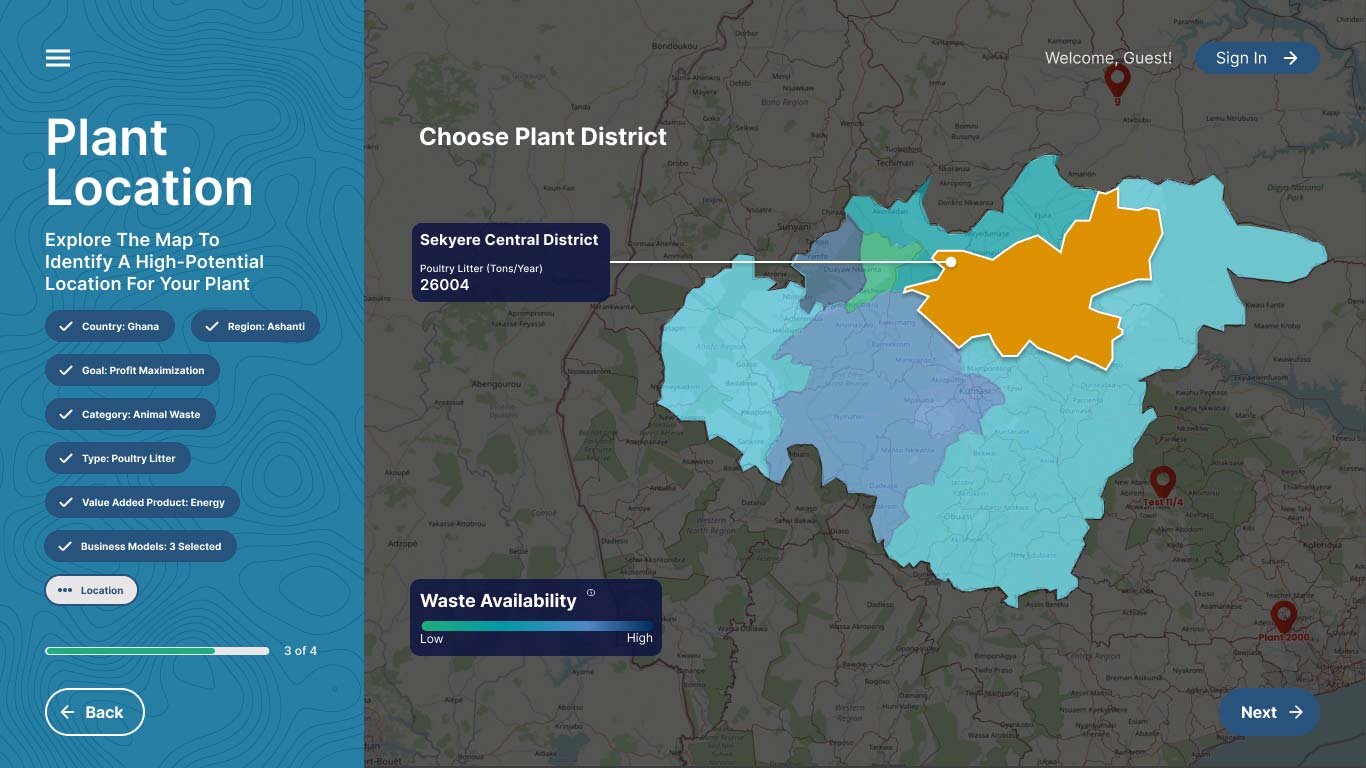
This step introduces an interactive geographical view of your selected region, broken down by district.

The color gradient represents waste availability: light green indicates lower volume, moving toward dark blue for the highest concentrations. Click on any district to view a tooltip with the exact waste availability measured in Tons/Year. Once you have identified a high-potential district, click Next.


4

Map Exploration and Facility Positioning

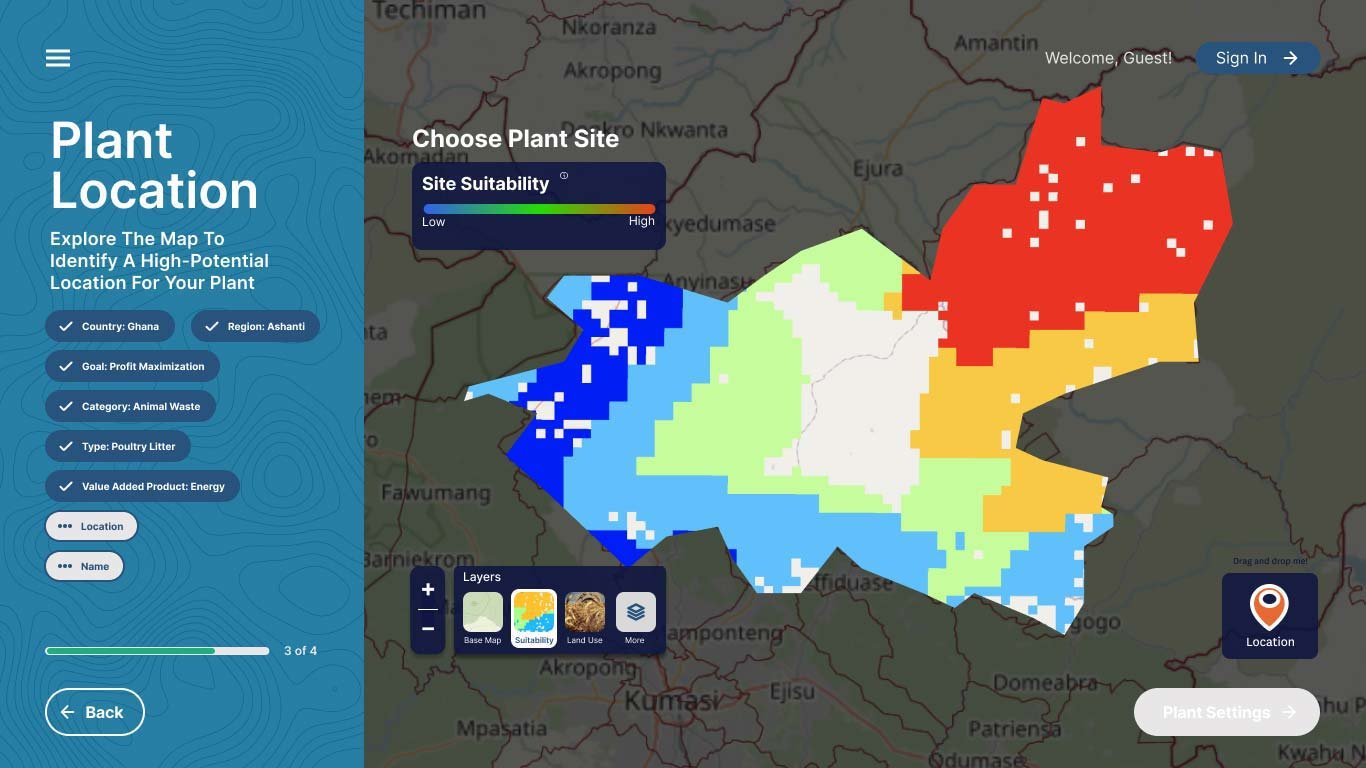
The map will zoom into your selected district, defaulting to the Site Suitability layer. This layer synthesizes various spatial indicators compiled by IWMI scientists to highlight optimal placement zones.

Before making your decision, use the layers panel to explore additional variables, including land use, elevation, and the local road network. When you have identified the ideal site, click the location pin icon at the bottom right, drop it directly onto your chosen map location, name your facility, and click Plant Settings.


5

Plant Settings

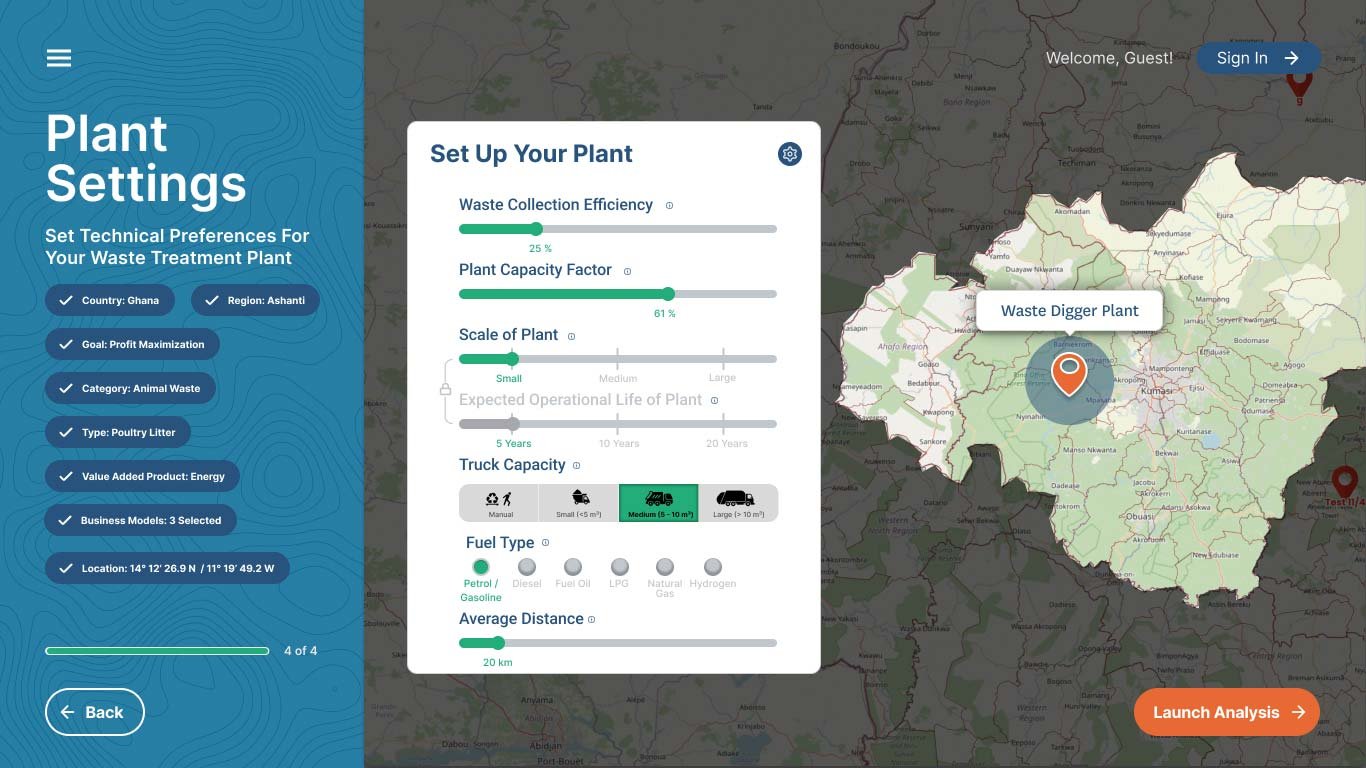
Configure the technical and operational constraints of your planned facility using the provided sliders and toggles:

– Waste Collection Efficiency (%)
– Plant Capacity Factor
– Scale of Plant (Small, Medium, Large)
– Transport Truck Capacity & Fuel Type
– Average Hauling Distance (km)

These variables directly influence the financial and environmental viability models. When ready, click Launch Analysis.


6

Multi-Criteria Decision Analysis (MCDA) Results

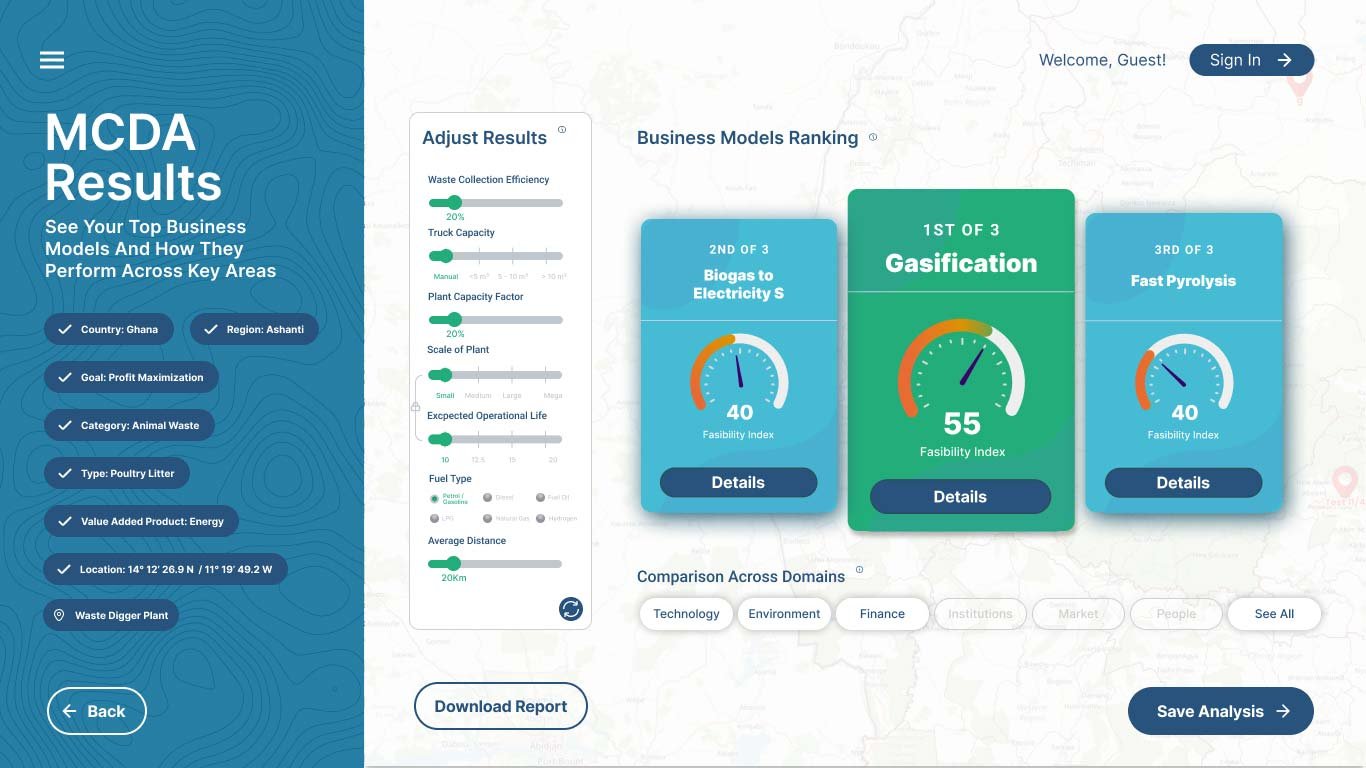
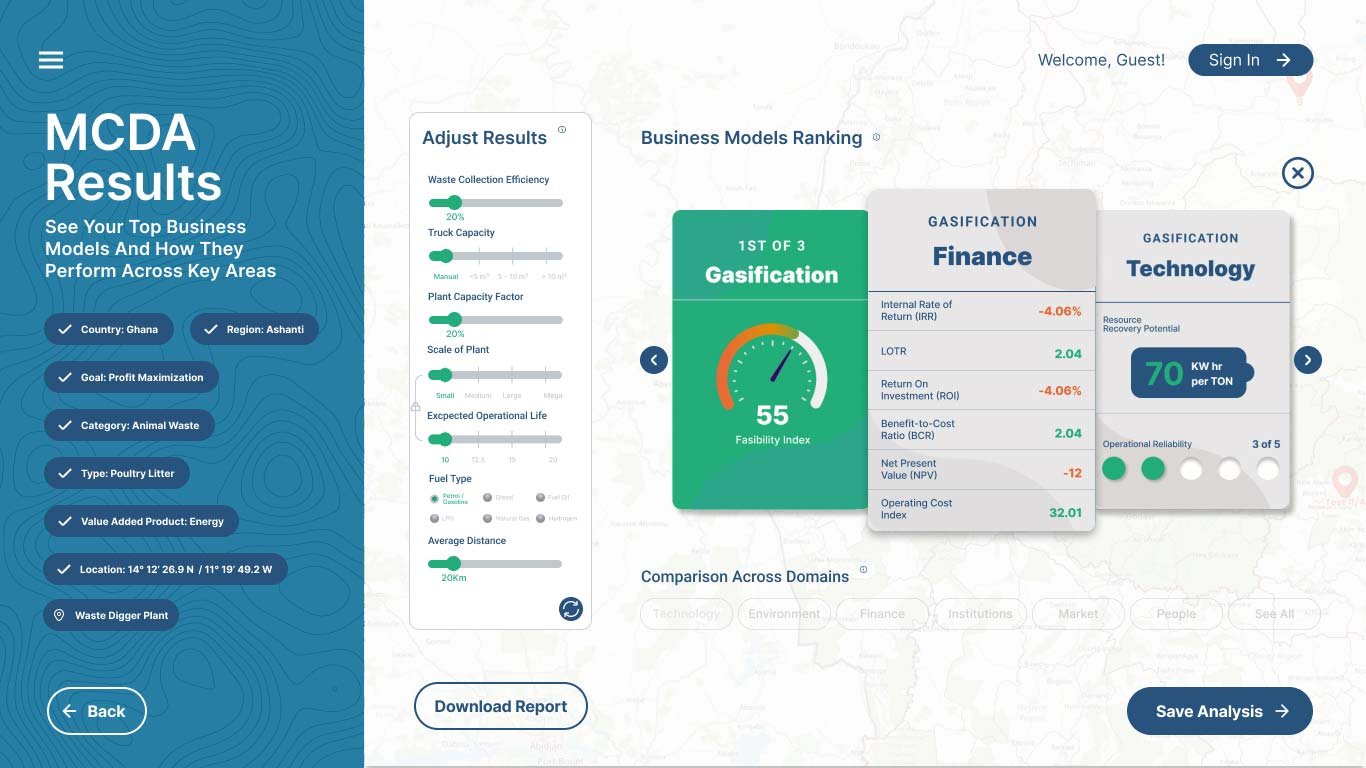
Congratulations! The system has processed your inputs against your chosen objectives. This screen displays a side-by-side performance ranking of your three selected business models, complete with an overall feasibility index score.


7

Domains and Indicators

Click Details on any business model card to open an in-depth breakdown. Here, you can examine distinct indicators across critical domains—such as financial returns (IRR, NPV), technology outputs, and environmental metrics—to justify your investment or policy decisions.


8

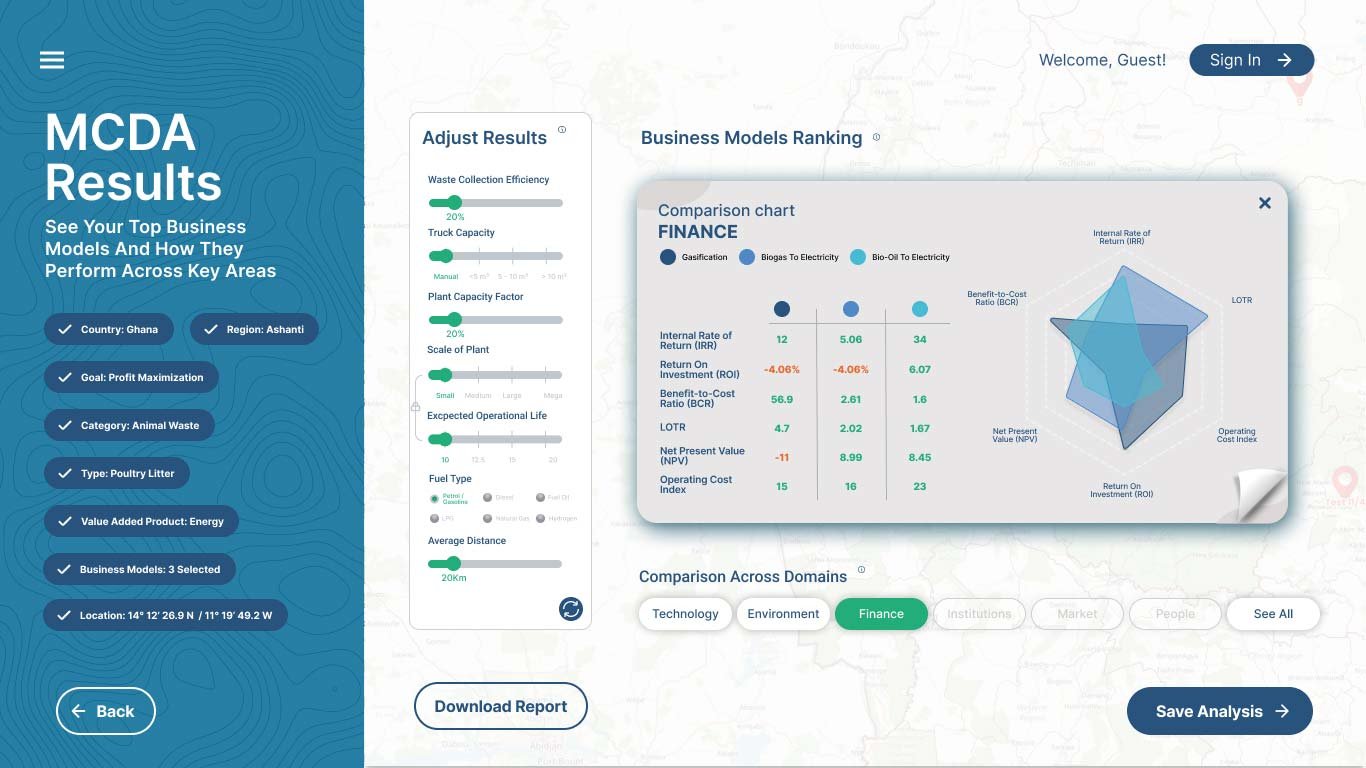
Business Models Comparison

Compare all three models simultaneously using the interactive radar charts and data tables. Evaluate them across technology, environmental impact, financial feasibility, and institutional readiness.

Real-Time Tweaking


9

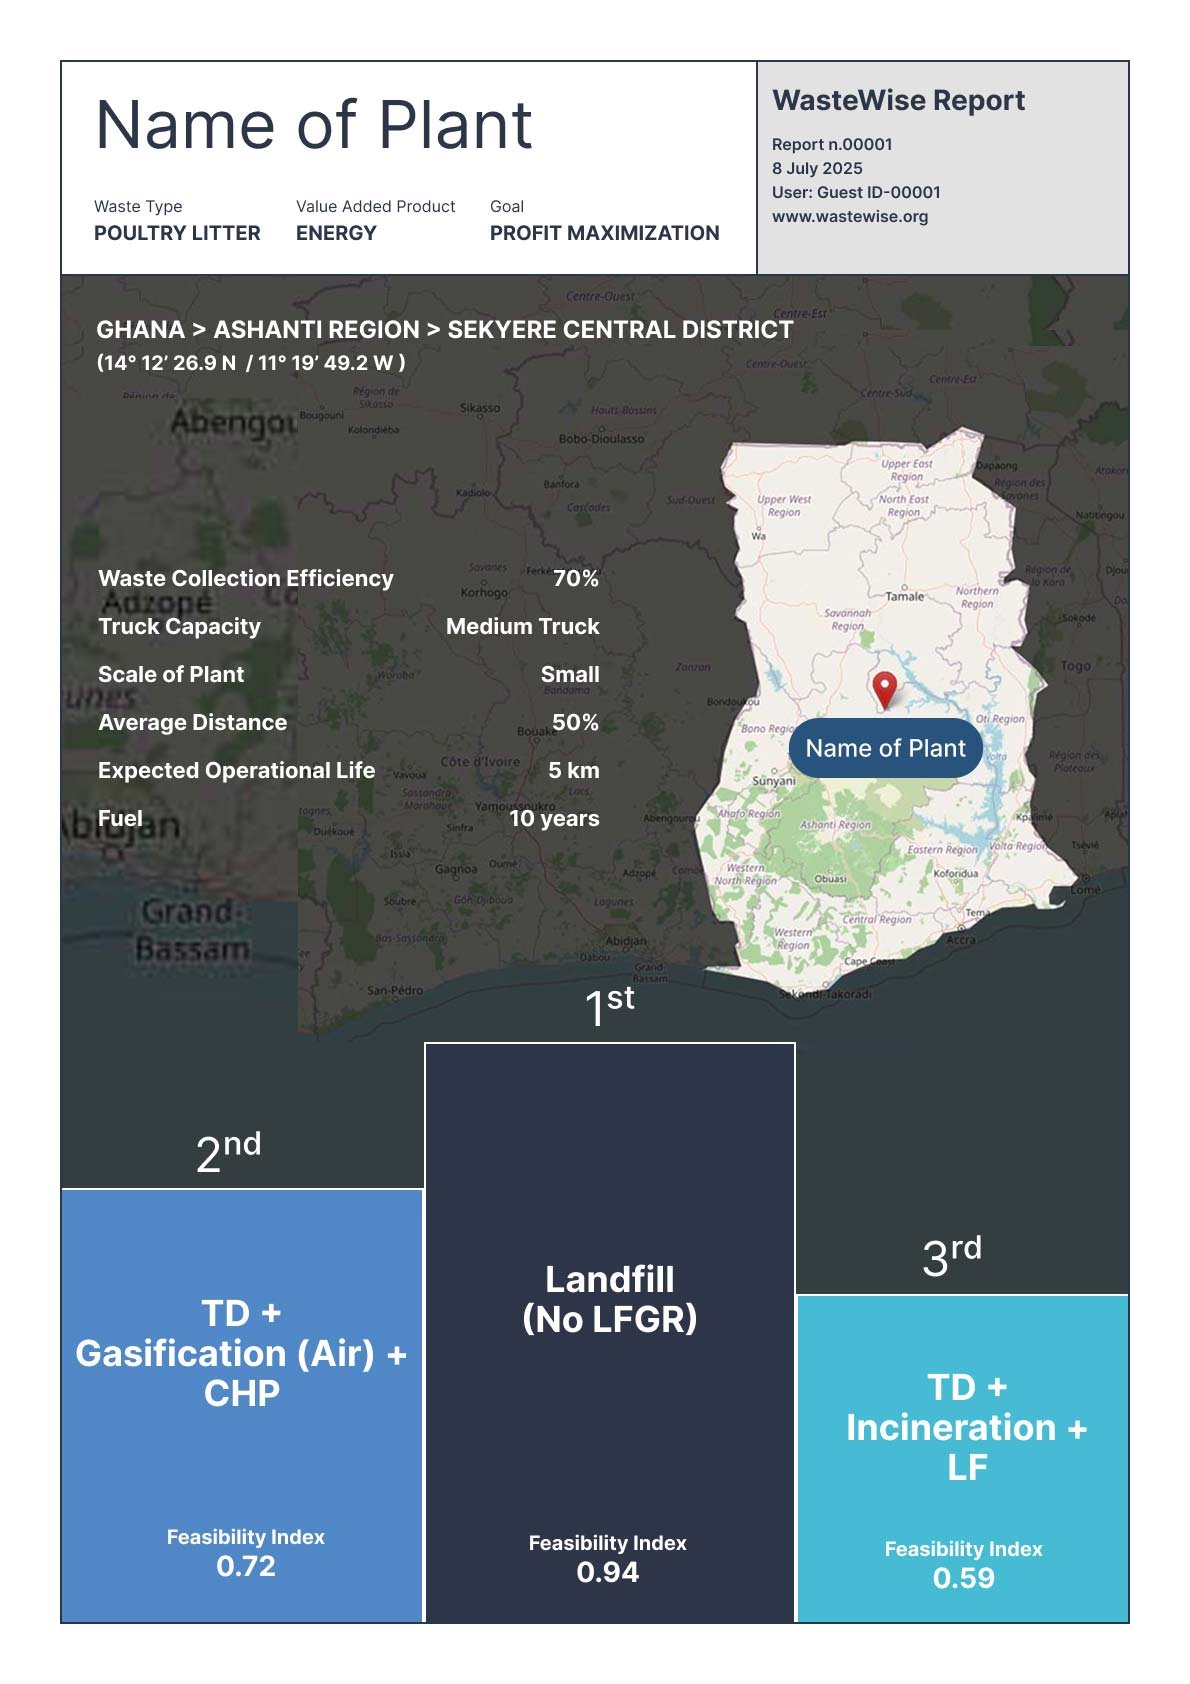
Report Download

Generate a comprehensive, 10+ page PDF report containing your specific parameters, map layouts, and comparative data charts. This file is ready to print, file, or share with project stakeholders.


10

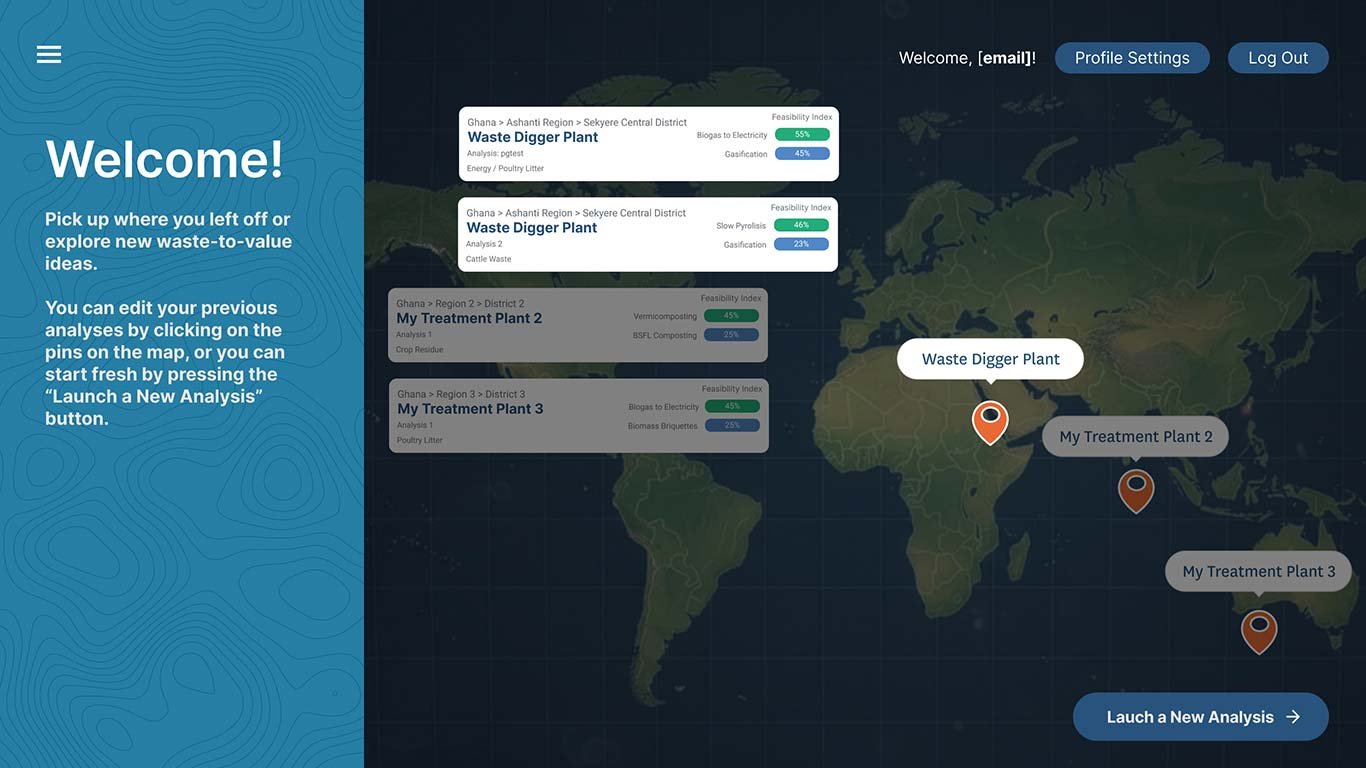
Account Management

Don’t let your work go to waste. If you haven’t already, log in or register for a free account to save your facility configuration for future editing.

Ready for a new project? Click Launch a New Analysis to start fresh or head below to explore the basin module.

Waste Hotspot & Basin Explorer

Step-by-step guide
1

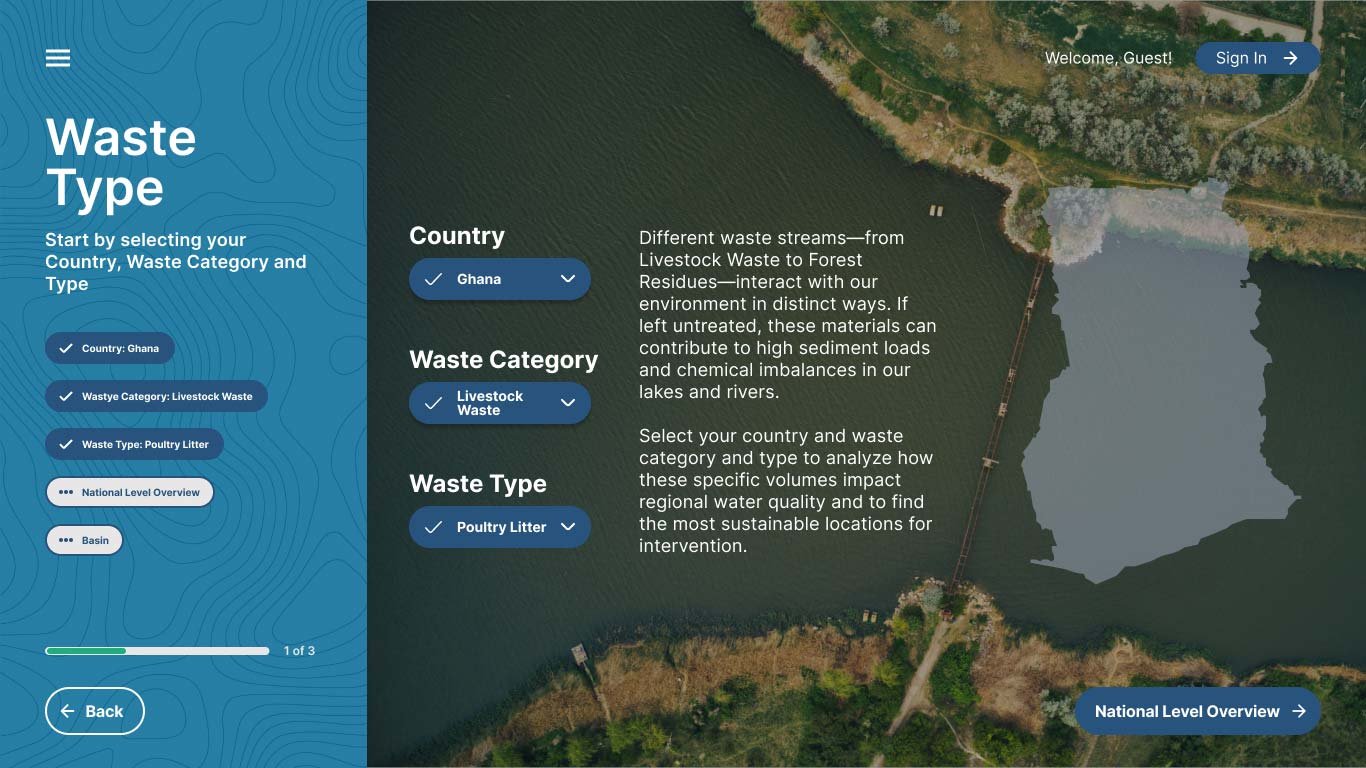
Select Country and Waste Type

Choose your target country, waste category, and waste type. This module maps how specific organic waste streams—ranging from livestock manure to agricultural residues—interact with the environment. If left unmanaged, these materials cause critical chemical imbalances and high sediment loads in local lakes and rivers.


2

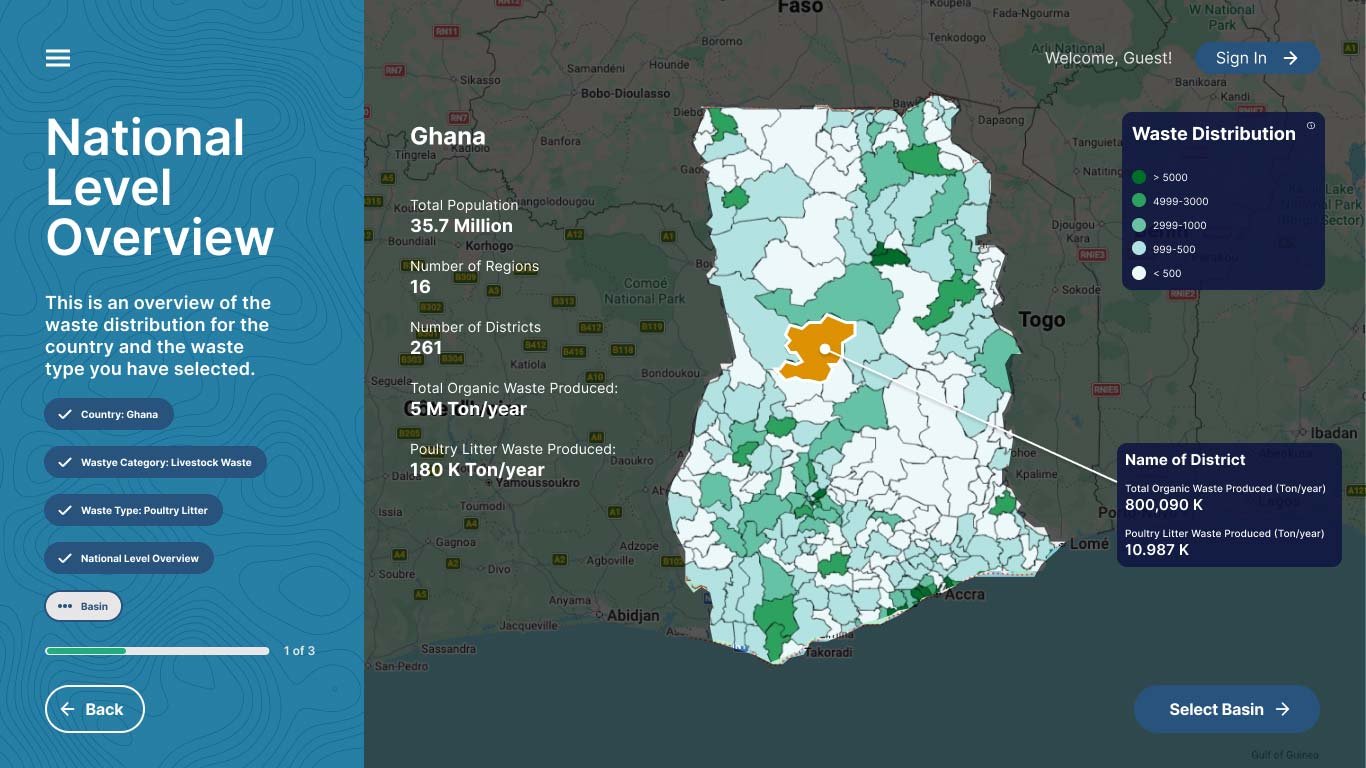
National Level Overview

Review the macro-level waste distribution across your chosen country. This dashboard displays total population, regional breakdowns, and national organic waste totals (e.g., Total Organic Waste vs. specific Waste Type volumes in Tons/Year). When you are ready to pivot from land to water impacts, click Select Basin.


3

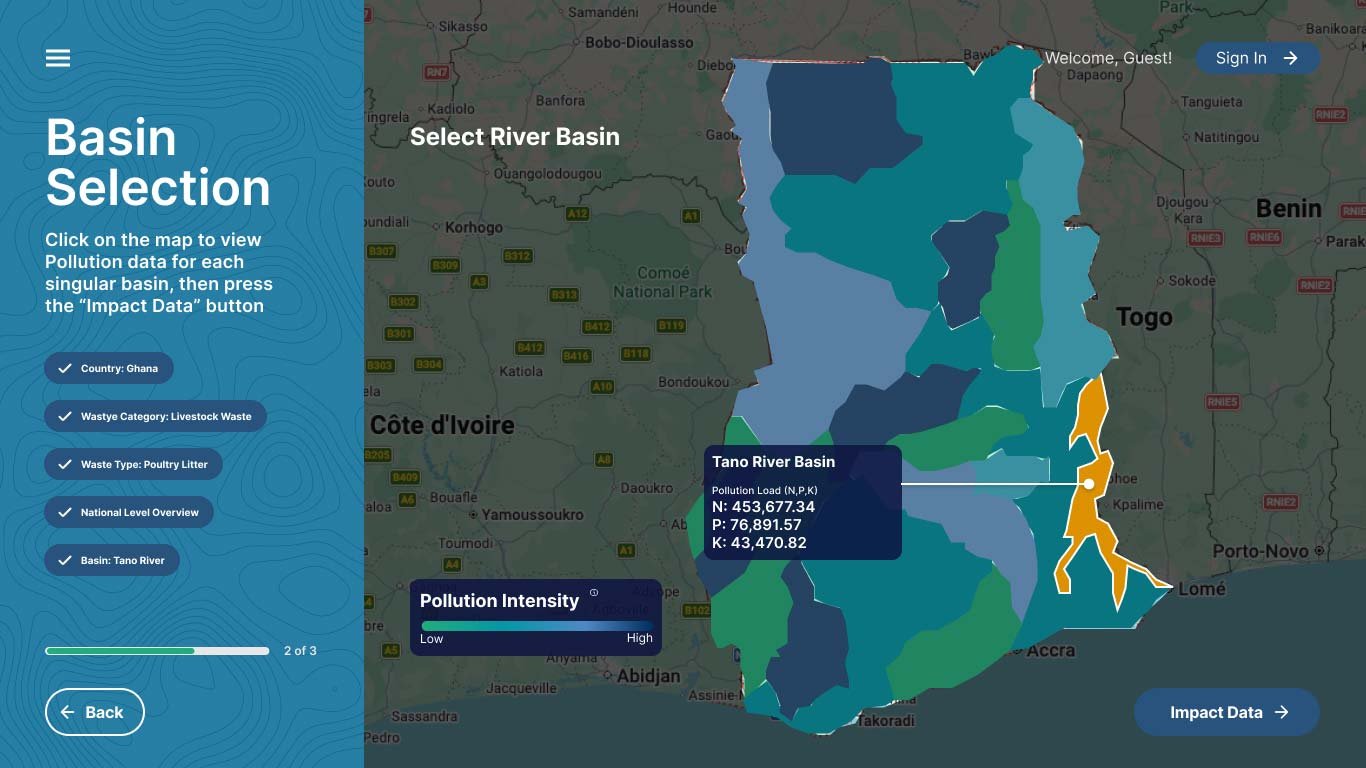
Basin Selection

The interactive map transitions to show defined hydrological boundaries. Districts are color-coded by pollution intensity. Click on any river basin to view calculated nitrogen (N), phosphorus (P), and potassium (K) pollution loads. Select your target basin and click Impact Data.


4

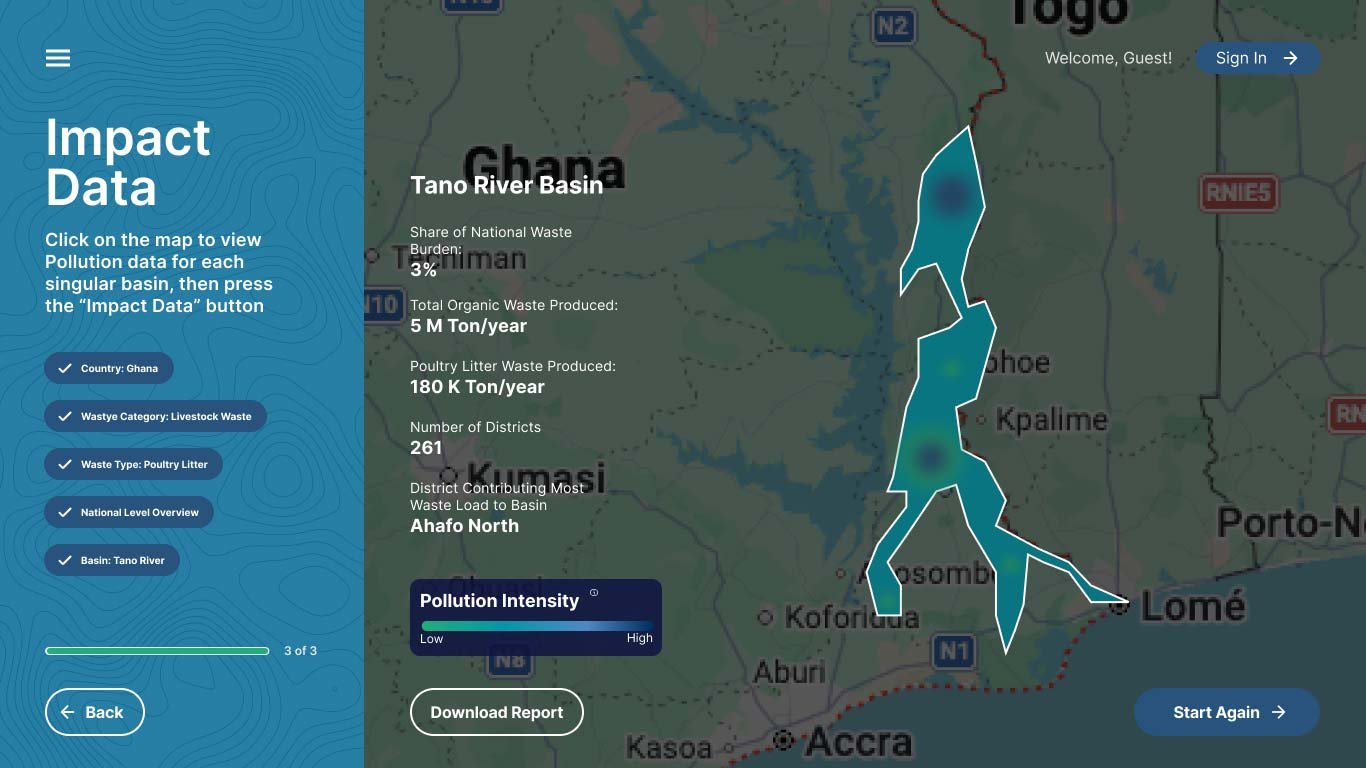
Impact Data Exploration

Dive into localized ecological metrics for your selected basin. This view highlights:

– The basin’s share of the national waste burden
– Total organic waste produced within the basin area
– The total number of administrative districts intersecting the basin
– The specific district contributing the highest waste load to the watershed


5

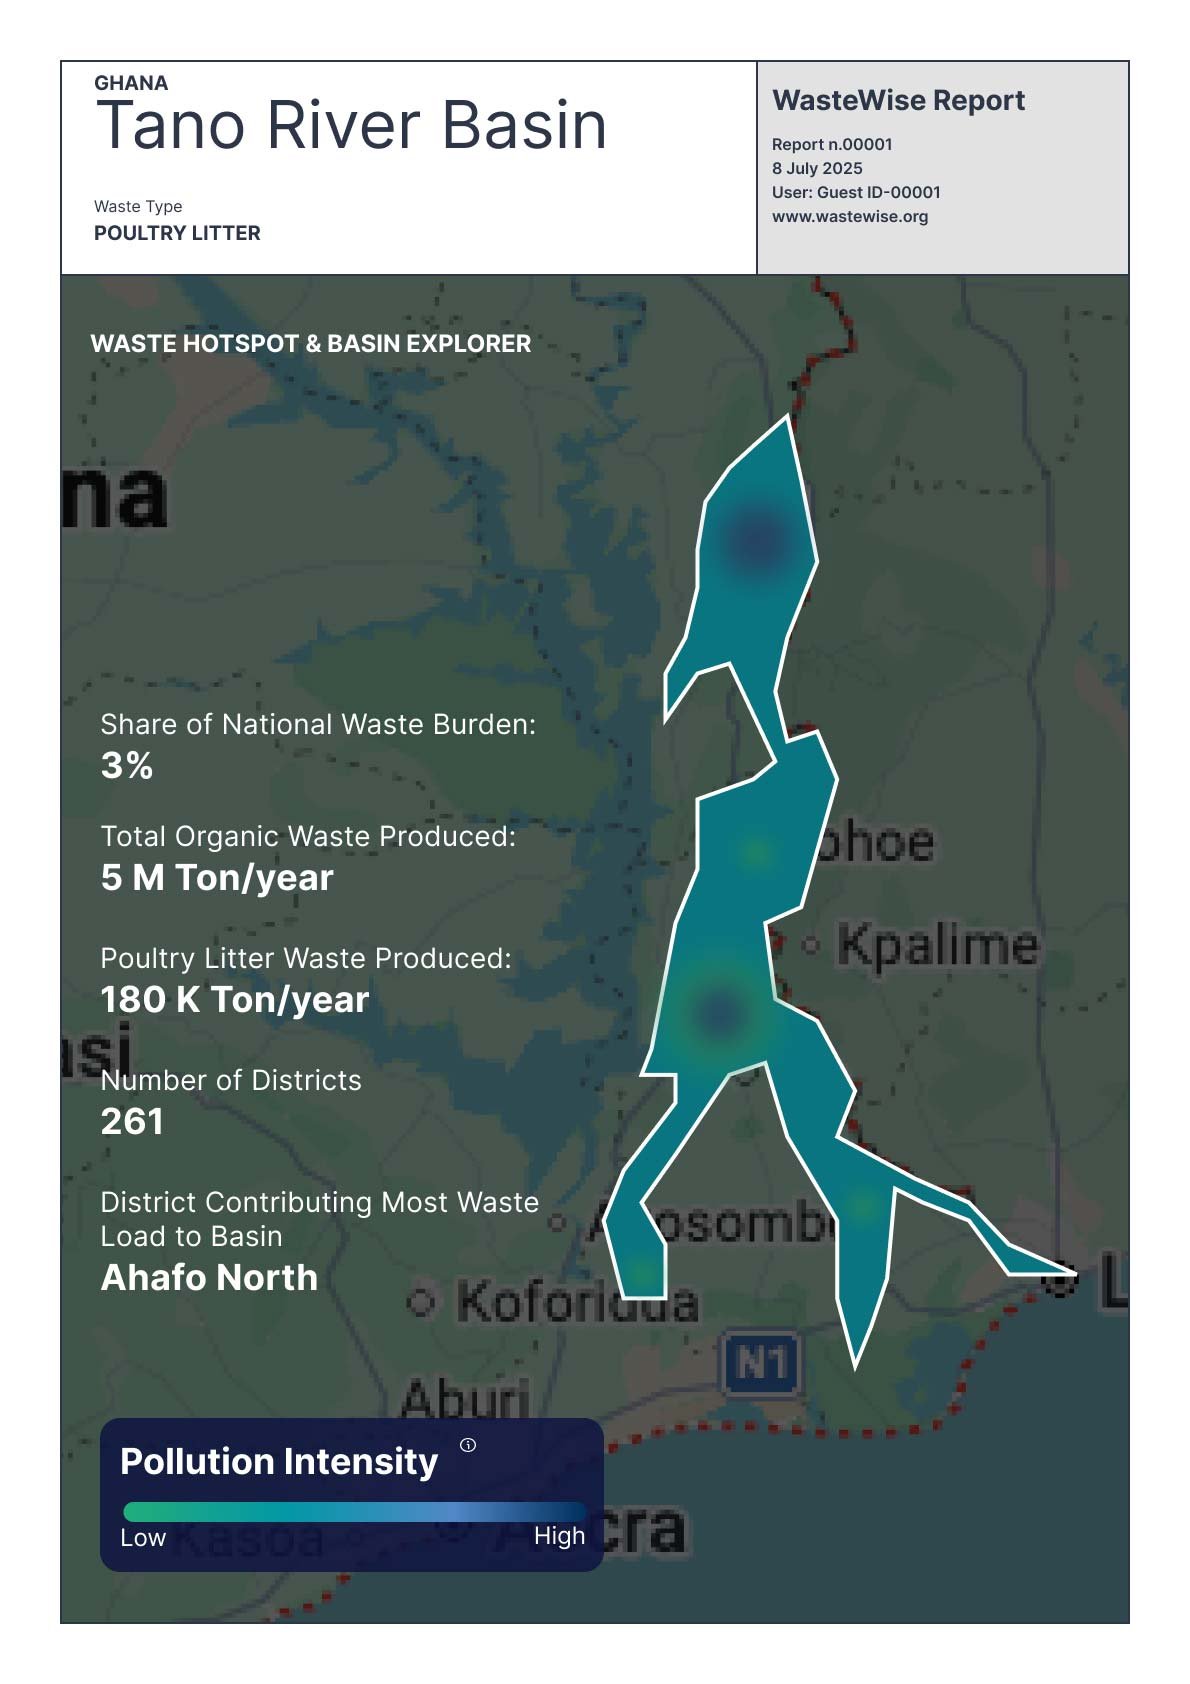
Download Basin Report

Export your findings into a clean, presentation-ready PDF report detailing localized watershed vulnerabilities. To start an investigation into a different region or waste stream, simply click the Start Again button.

Scroll to Top